
How to choose the right process mining vendor for your business
Process mining is critical for businesses that want to optimize their operations, reduce costs, and improve customer satisfaction. However, choosing the best...

Ever wondered how you could establish a data-based approach to monitoring SLAs, detect fraud, or follow on-time delivery?
With process mining (read: what is process mining), you can continuously and effortlessly monitor and report how well you follow both internal and external agreements - based on real-time data.
Process mining takes the process data that's already available in your ERP or CRM systems and turns this data into automatic process visualizations. This allows you to see how your process happens in reality, but also to track, monitor, and predict a variety of important key performance indicators.
With the latest additions to the process mining software QPR ProcessAnalyzer, you can now easily detect costly errors and fraud with the Four Eyes Principle, avoid violating Service-Level Agreements and ensure accurate On-Time Delivery across all business areas.
Together with the newly added conditional formatting for tables, they allow you to gain more in-depth insights into processes much faster than before - and easily communicate these fact-based insights to all stakeholders.
In this blog, we'll show you how you can use Process KPI Reporting charts to monitor service-level agreements (SLAs) and identify violations, use the Four Eyes Principle to detect fraud, and ensure accurate on-time delivery.
All charts are ready-made, yet fully customizable, and provide a comprehensive way of analyzing how well your organization is performing in key areas:
Service-level agreements (SLAs) refer to a quantifiable level of service expected by a customer from a supplier, or sometimes, the level of service between two departments in a company. If the agreed-upon service level isn't reached, which is referred to as an SLA violation, the result is often a payment or discount to the customer.
Violating SLAs is something you should avoid for several reasons: not only to avoid any unnecessary payments but also to maintain a good reputation and good customer relations.
SLAs ensure that both parties are on the same page, which helps keep the relationship on the right track and builds trust. Examples of SLAs include:
QPR ProcessAnalyzer makes it easier to track service-level agreement compliance with three new charts that users can immediately start using to analyze SLAs.
Unlike with traditional BI reporting, you will instantly get an overview of all your organization's past and present service level agreements, individual violations, trends, and root causes for violations - visualized both in a flowchart and as a ranking based on their business impact.
Below, we'll give examples of using these charts for the Order-to-Cash process.
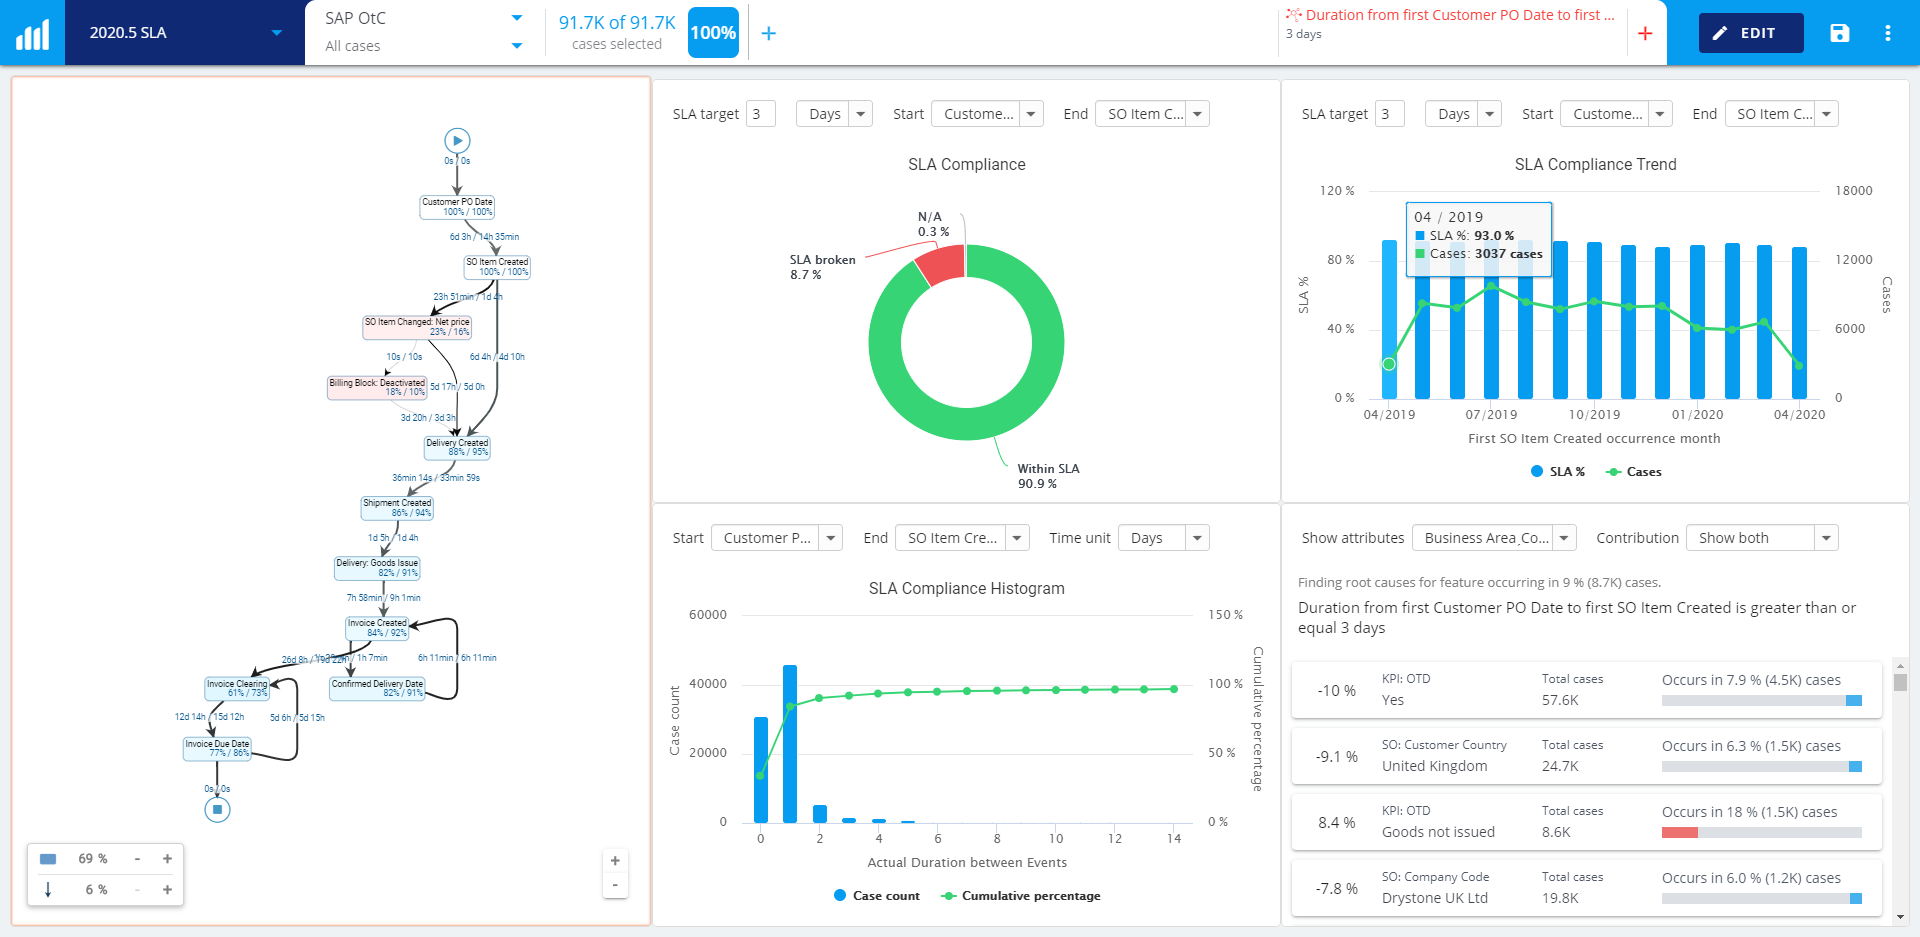
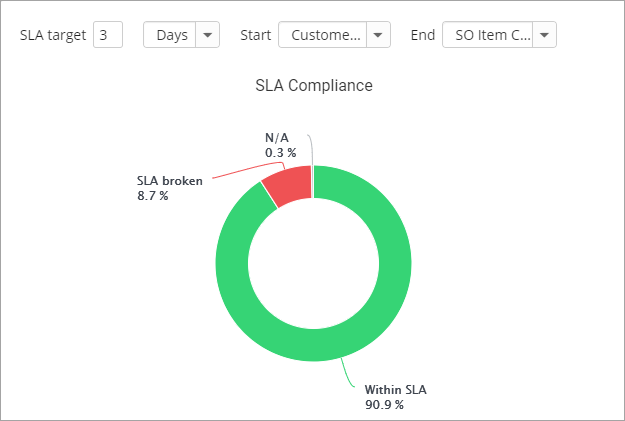
SLA Compliance: How many SLA violations are there overall?
With the SLA Compliance Chart, you set the SLA target (for example, 3 days) between two events, and you will instantly see the percentage of cases in the process where the SLA has been broken.
In this example, the target is set to 3 days. This means that if it takes longer than 3 days from the "Customer Purchase Order Created" to "Sales Order Item Created", the SLA has been broken.
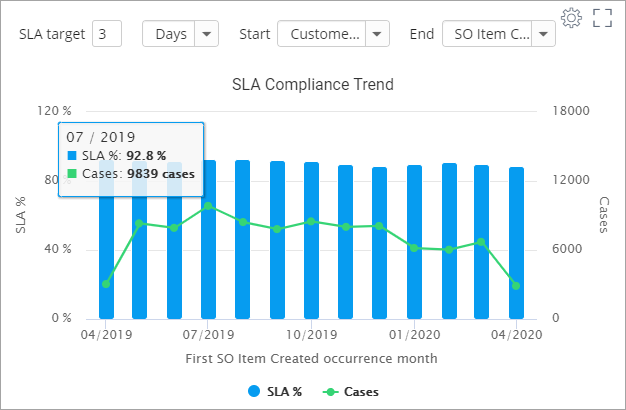
SLA Compliance Trend: Are there weekly, monthly, or quarterly changes in your SLA violations?
The SLA Compliance Trend helps you monitor how your SLA compliance has changed over time.
In this example, you can see that in June 2019, 92.8 % of all 9839 cases complied with SLAs, whereas in December, only 89 % of all 8089 cases complied with SLAs.
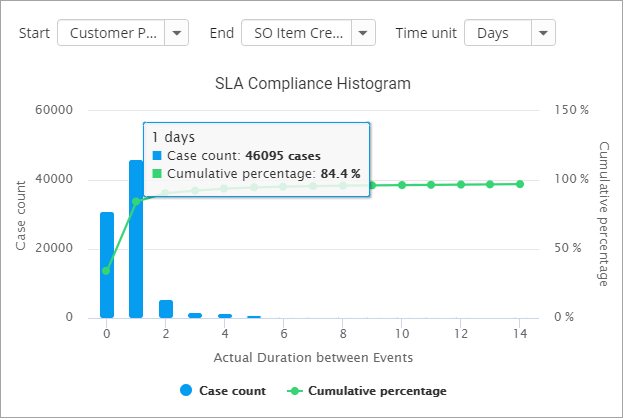
SLA Compliance Histogram: Break down your SLA KPI
If the duration between the events ("Customer Purchase Order Created" and "Sales Order Created") is 1 day, you can see that already 84.4 % of the Sales Orders have been created.
Needless to say, it should not take many days (or weeks) between the creation of the customer's purchase order and the creation of the sales order.
However, when the sales order creation has taken longer than 7 days (i.e. longer than our target), we can see that 95.6 % of sales orders have been created - but that we are still missing that 4,4 %. What happened? Select the duration you want to investigate and choose the root cause symbol.
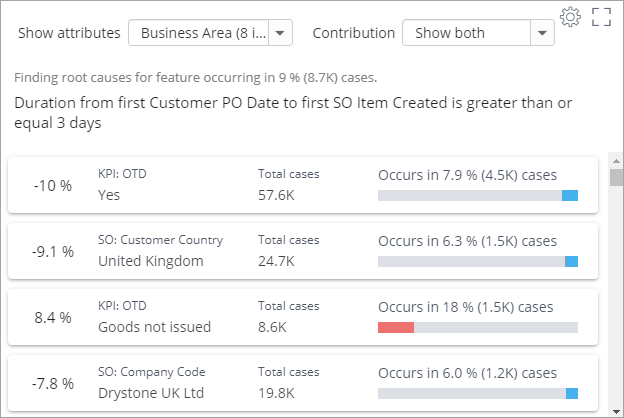
Lastly, you can see the root causes of the SLA violations. These are highlighted in the flowchart, as you can see from the dashboard at the beginning of the blog, but they are also shown as a chart. The chart shows the root causes for cases that violate service-level agreements.
In large enterprises, key operational risks include fraud and error. Undetected, especially in large volumes, fraud and error will undeniably add up to substantial costs for enterprises. Therefore, internal control mechanisms that help reduce these kinds of undetected errors or fraud are important to have in place.
There are several ways to minimize the risk of fraud or undetected errors slipping through - most of which include involving several people or technologies throughout the activity's life cycle.
One of these methods is referred to as the "Four Eyes Principle" (also known as the Two-man Rule). The Four Eyes Principle is an internal control mechanism that requires a certain activity to be approved by at least two people - four eyes.
The idea behind this principle is that no employee should be able to both commit and hide fraud or errors (intentionally or accidentally).
With process mining, you can easily detect all breaches of the Four Eyes Principle, which helps you ensure the efficiency of your processes and transparently monitor them. Below, we'll take a look at ready-made Four Eye Principle charts in the Purchase-to-Pay process.
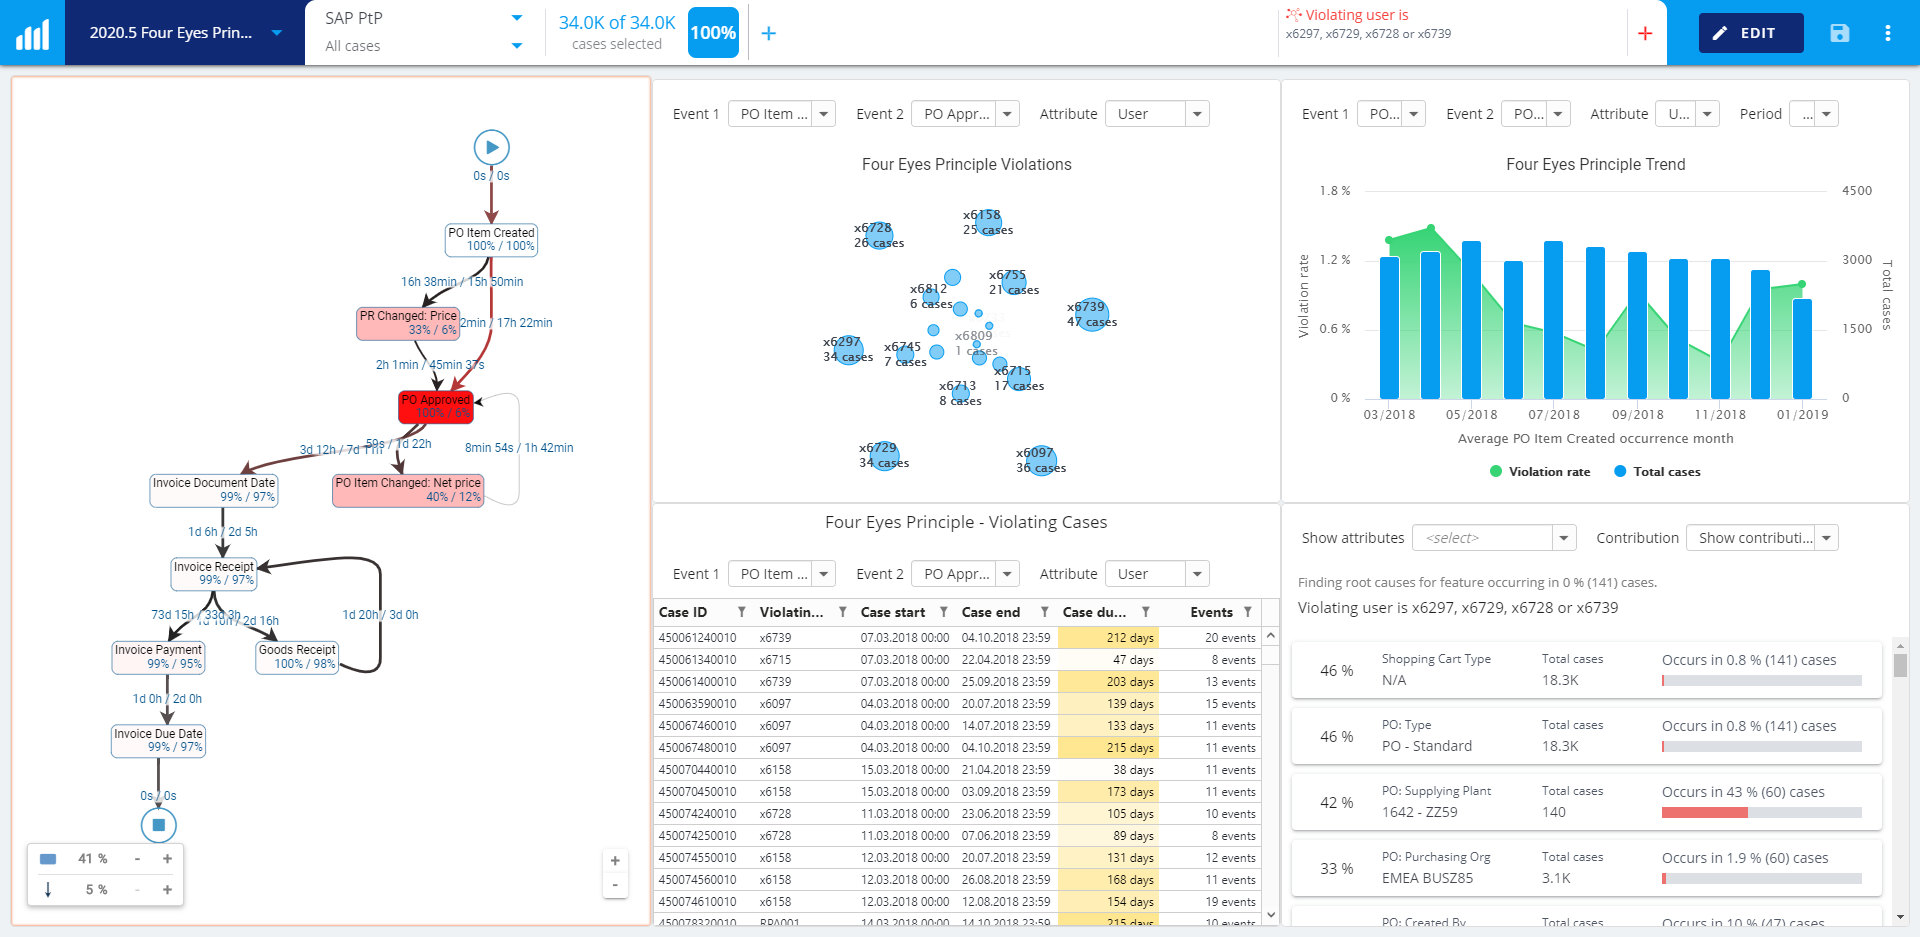
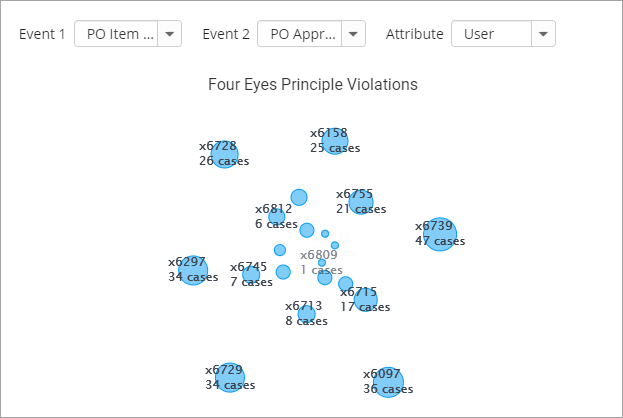
Four Eyes Principle Violations: Spot which users are violating the principle
In the Four Eyes Principle Violations chart, you can choose two events in which users should follow the Four Eyes Principle (such as PO Item Created and PO Approved) and easily see which users are violating the principle the most.
Here you can see that user x6739 has made the purchase order in 47 cases and approved them too.
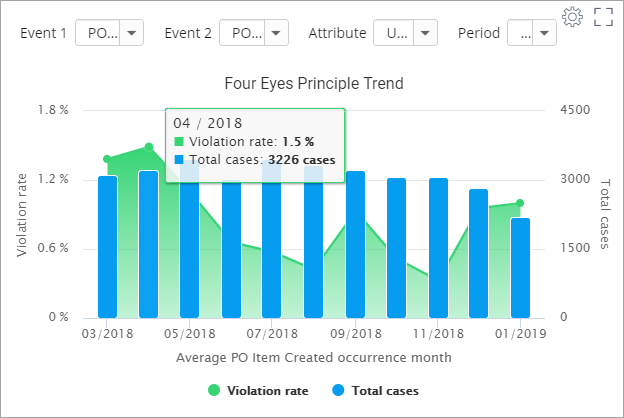
Four Eyes Principle Trend: Has compliance improved over time?
Check how the Four Eye Principle violation rate has changed over time - has it improved?
Below, you can see that at the beginning of 2018, more violations happened (1,5 %) than by the end of the year. You can also see that in August 2018, although there were quite many cases, the violation rate was down to 0.4 %.
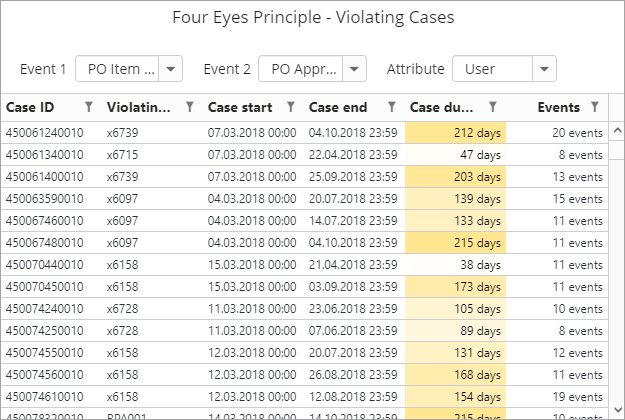
Four Eyes Principle Violating Cases: Which individual cases have gone wrong?
This chart highlights individual violating cases. In this example, you can see the case IDs for the Purchase Orders that have gone wrong, which allows you to investigate them further in SAP and consider how they should be improved.
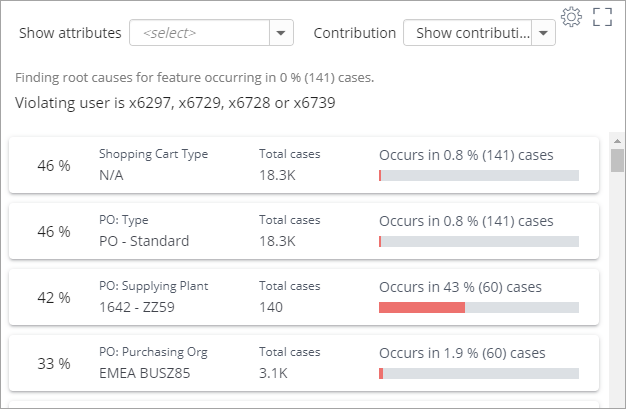
Root Causes for Four Eyes Principle:
With this Root Cause chart, you can first select the biggest bubbles - the most violating users - from the Four Eyes Principle chart and check root causes for these violations.
You can for instance see that a specific Supplying Plant (1624 - ZZ59) contributes a lot to the violations.
“QPR ProcessAnalyzer allows us to follow up on worldwide execution of processes from the headquarters. With Root Cause Analysis, we found out why certain tasks are often done incorrectly. These insights substantiate our decisions to automate said tasks and implement a four-eye principle.” - Sander Van Lombeek, Team Lead of Commercial Credits at KBC Group.
Another set of insightful charts in the new release is On-Time Delivery. You can use this chart to analyze not only on-time delivery of goods, but also payments, or production.
In the On-Time Delivery charts, you compare the promised time for the fulfillment of the activity with the actual time it has taken to execute the activity. You can analyze for example the following types of On-Time Delivery:
In our example, we'll take a look at the Order-to-Cash process. 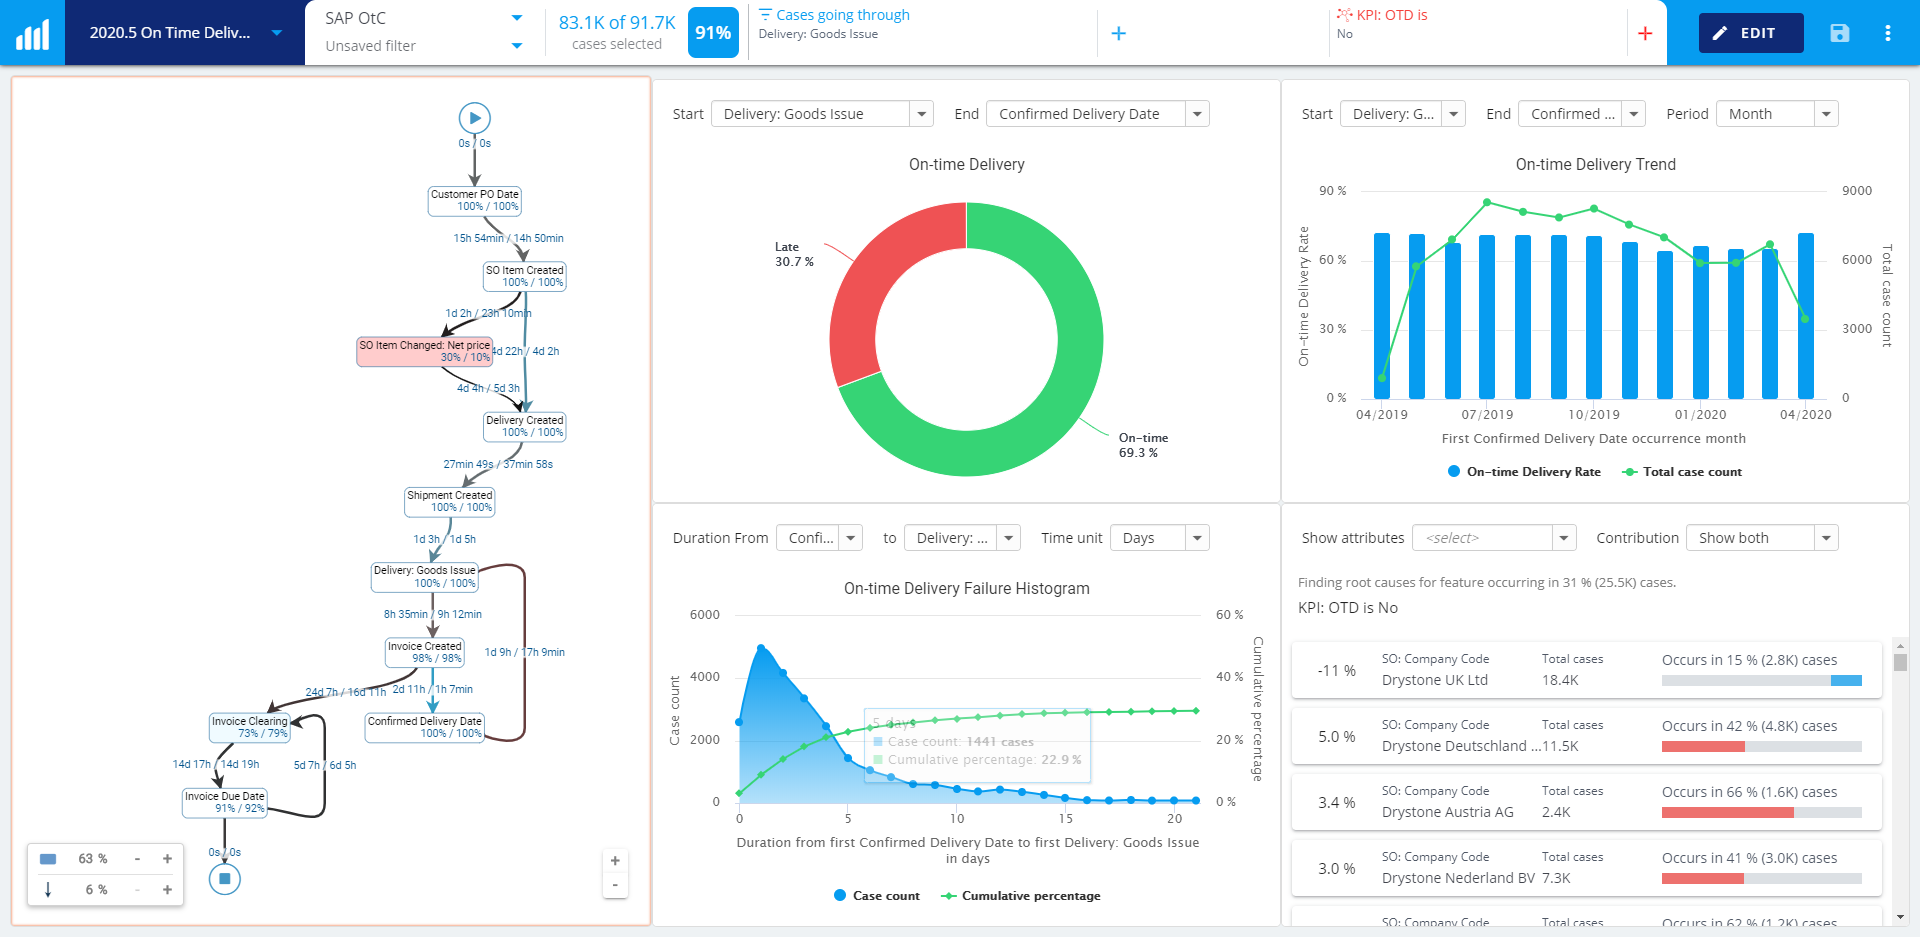
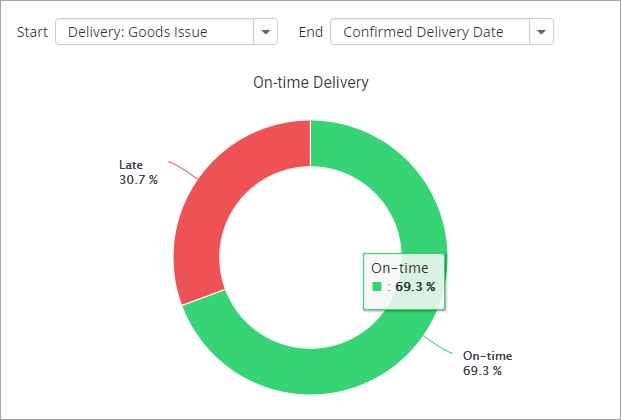
On-Time Delivery: How many of all your orders are delivered on time?
Do you know how many of all your orders are delivered on time? The On-Time Delivery KPI chart will give you this information.
As can be seen from the screenshot below, only 69.3 % of all orders are delivered on time.
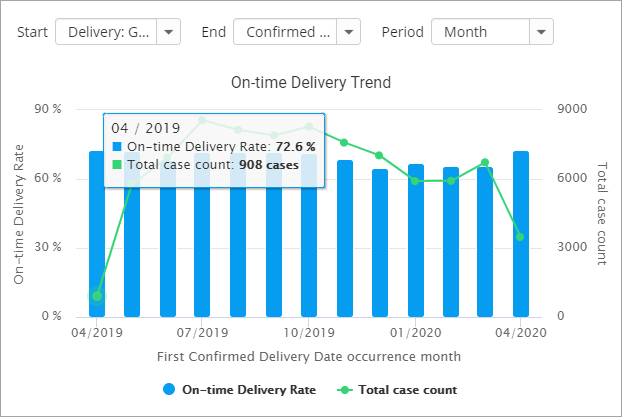
On-Time Delivery Trend: Have on-time deliveries improved over time?
Measure and monitor how your on-time deliveries have changed over time.
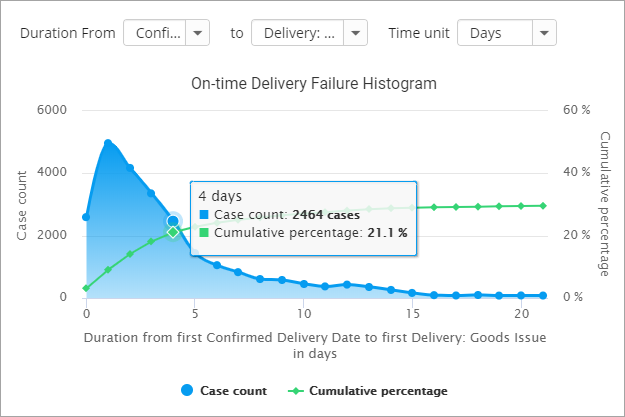
On-Time Delivery Failure Histogram:
From this histogram, you see how the late deliveries are distributed and how many cases were late for each given duration.
For example, there are a total of 2464 cases that were 4 days late. In addition, you see that 21.1 % of all cases were between 0 and 4 days late.
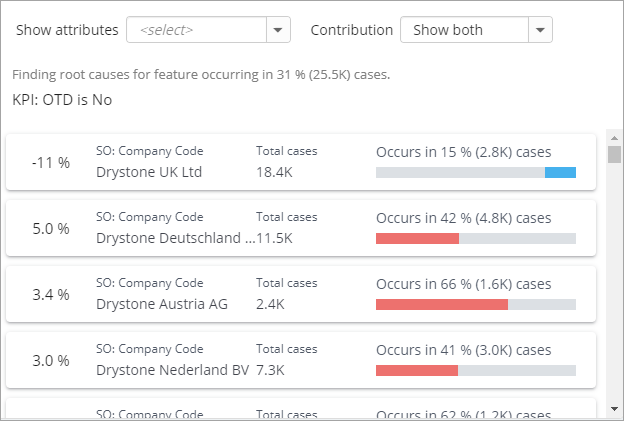
Root Causes of late deliveries:
From this root cause chart, you will easily identify the main reasons behind late deliveries.
In this example, you see that if the Sales Organization is Drystone UK, then the deliveries are 16 % more likely to be on time when compared to average deliveries.
However, if the Sales Organization is Deutschland, Austria, and Nederland, the deliveries are more likely to be late.
Moreover, QPR ProcessAnalyzer 2020.5 includes conditional formatting for tables, a simplified dashboard structure, as well as expression language and performance improvements.
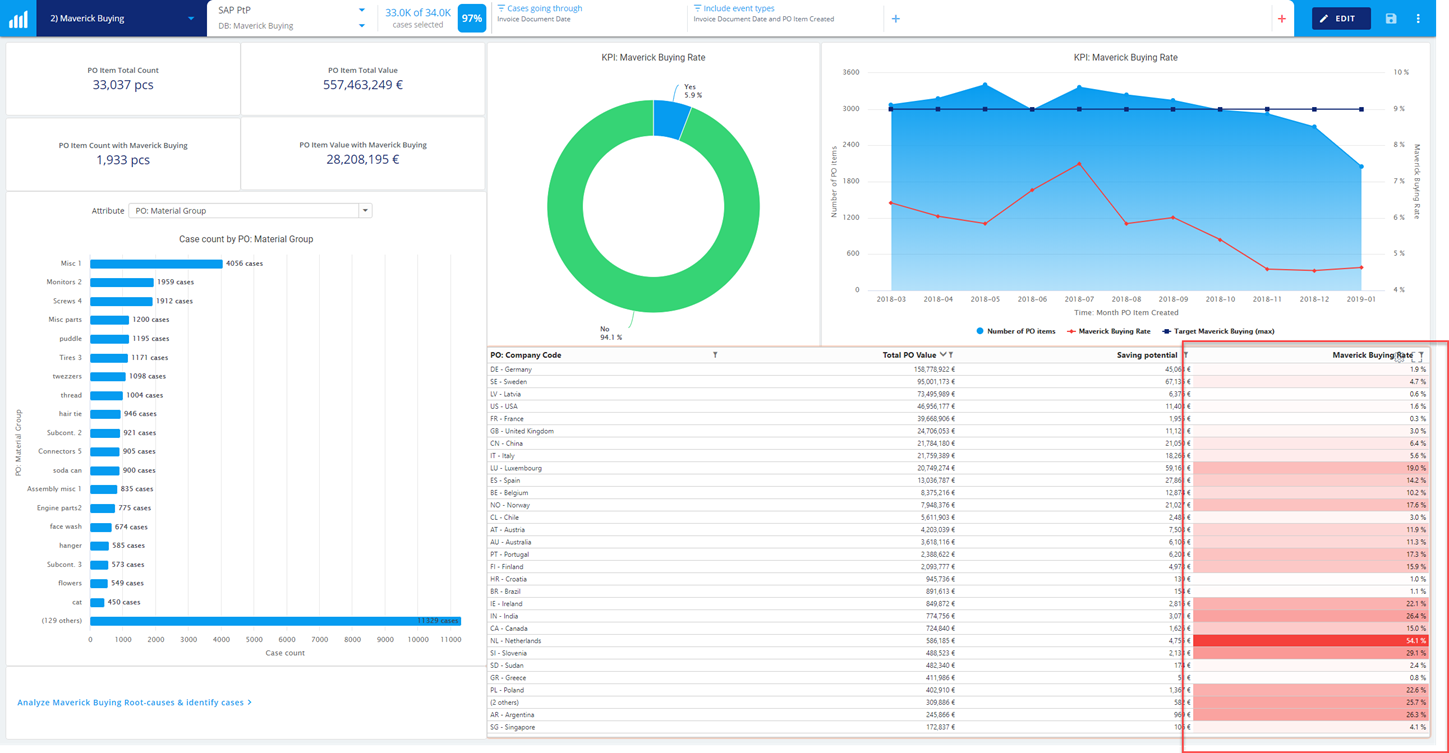
With this release, we have added conditional formatting for tables. Conditional formatting makes it easier than ever to highlight and differentiate information in your process mining dashboards.
Below, on the right-hand side of the screen capture, you see conditional formatting used in the Maverick Buying dashboard for the Purchase-to-Pay process. From this view, you'll instantly spot in which geographical area Maverick Buying happens the most (sorted by business size).
These are some of the features of the new QPR ProcessAnalyzer, 2020.5 😊
If you’re already using QPR ProcessAnalyzer, go ahead and try these new features when you get a chance. If not, and if you’re new to Process Mining, read more on this page. If you want to know more about QPR ProcessAnalyzer, don’t hesitate to book a demo.

Share Online

Process mining is critical for businesses that want to optimize their operations, reduce costs, and improve customer satisfaction. However, choosing the best...
Are you considering creating a Digital Twin of an Organization to transform your company into a digital organization? Learn the what, why, and how in this blog...

The importance of a company's data strategy in relation to its process mining decisions cannot be overstated.
In today's challenging business landscape, efficiency is the key to staying competitive. At QPR, we're constantly evolving to meet the dynamic needs of our...